 This Tuesday, May 24th the Bizo dev team will be attending the MongoSF conference. Hope to see you there. We're also sponsoring the after-party at Oz Lounge. Stop by, say "hello," and let us buy you a drink!
Sunday, May 22, 2011
Bizo @ MongoSF
 This Tuesday, May 24th the Bizo dev team will be attending the MongoSF conference. Hope to see you there. We're also sponsoring the after-party at Oz Lounge. Stop by, say "hello," and let us buy you a drink!
Thursday, May 19, 2011
Cloudwatch custom metrics @ Bizo
Now that Cloudwatch Custom Metrics are live, I wanted to talk a bit about how we're using them here at Bizo.
We've been heavy users of the existing metrics to track requests/machine counts/latency, etc. as seen here. We wanted to start tracking more detailed application-specific metrics and were excited to learn about the beta custom metric support.
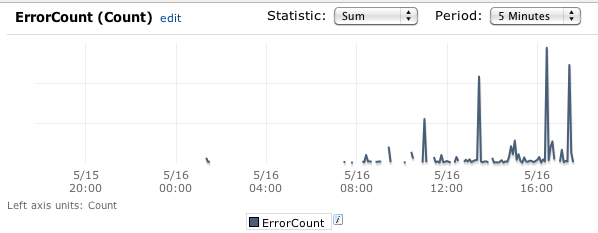
 For error metrics, we use "ErrorCount" as the metric name, with the following dimensions:
Error Tracking
The first thing we decided to tackle tracking were application errors. We were able to do this across our applications pretty much transparently by creating a custom java.util.logging.Handler. Any application log message that crosses the specified level (typically SEVERE, or WARNING) will be logged to cloudwatch. For error metrics, we use "ErrorCount" as the metric name, with the following dimensions:
- Version, e.g. 124021 (svn revision number)
- Stage, e.g. prod
- Region, e.g. us-west-1
- Application, e.g. api-web
- InstanceId, e.g. i-201345a
- class, e.g. com.sun.jersey.server.impl.application.WebApplicationImpl
- exception, e.g. com.bizo.util.sdb.RuntimeDBException
Other Application Metrics
We expose a simple MetricTracker interface in our applications:
interface MetricTracker {
  void track(String metricName, Number value, List<Dimension> dimensions);
}
The implementation handles internally buffering/aggregating the metric data, and then periodically sending batches of cloudwatch updates.
This allows developers to quickly add tracking for any metric they want. Note that with cloudwatch, there's no setup required, you just start tracking.
Wishlist
It's incredibly easy to get up and running with cloudwatch, but it's not perfect. There are a couple of things I'd like to see:- More data - CW only stores 2 weeks of data, which seems too short.
- Faster - pulling data from CW (both command line and UI) can be really slow.
- Better suport for multiple dimensions / drill down.
stage=prod,version=123, you can ONLY retrieve stats by querying against stage=prod,version=123. Querying against stage=prod only or version=123 only will not produce any results.
You can work around this in your application, by submitting data for all permutations that you want to track against (our MetricTracker implementation works this way). It would be great if couldwatch supported this more fully, including being able to drill down/up in the UI.
Alternatives
We didn't invest too much time into exploring alternatives. It seems like running an OpenTSDB cluster, or something like statds would get you pretty far in terms of metric collection. That's only part of the story though, you would also definitely want alerting, and possible service scaling based on your metrics.Overall Impressions
We continue to be excited about the custom metric support in Cloudwatch. We were able to get up and running very quickly with useful reports and alarms based on our own application metrics. For us, the clear advantage is that there's absolutely no setup, management or maintenance involved. Additionally, the full integration into alarms, triggers, and the AWS console is very key.Future Use
We think that we may be able to get more efficient machine usage by triggering scaling events based on application metric data, so this is something we will continue to explore. It's easy to see how the error tracking we are doing can be integrated into a deployment system to allow for more automated rollout/rollback by tracking error rate changes based on version, so I definitely see us heading in that direction.Monday, May 16, 2011
Synchronizing Stashboard with Pingdom alerts
First, what's Stashboard? It's is an open-source status page for cloud services and APIs. Here's a basic example:
Alright, now what's Pingdom? It's a commercial service for monitoring cloud services and APIs. You define how to "ping" a service, and Pingdom periodically checks if the service is responding to the ping request and if not, sends email or SMS alerts.
See the connection? At Bizo, we've had Stashboard deployed on Google's AppEngine for a while but we were updating the status of services manually -- only when major outages happened.
Recently, we've been wanting for something more automated and so we decided to synchronize Stashboard status with Pingdom's notification history and came out with the following requirements:
- Synchronize Stashboard within 15 minutes of Pingdom's alert.
- "Roll-up" several Pingdom alerts into a single Stashboard status (i.e., for a given service, we have several Pingdom alerts covering different regions around the world but we only want to show a single service status in Stashboard)
- If any of the related Pingdom alerts indicate a service is currently unavailable, show "Service is currently down" status.
- If the service is available but there have been any alerts in the past 24 hours, show "Service is experiencing intermittent problems" status.
- Otherwise, display "Service is up" status.
There are several ways we could have implemented this. We initially thought about using AppEngine's Python Mail API but decided against it since we're not familiar enough with Python and we didn't want to customize Stashboard from the inside. We ended up doing an integration "from the outside" using a cron job and a Ruby script that uses the stashboard and the pingdom-client gems.
It was actually pretty simple. To connect to both services,
require 'pingdom-client'
require 'stashboard'

pingdom = Pingdom::Client.new pingdom_auth.merge(:logger => logger)

stashboard = Stashboard::Stashboard.new(
  stashboard_auth[:url],
  stashboard_auth[:oauth_token],
  stashboard_auth[:oauth_secret]
)
then define the mappings between our Pingdom alerts and Stashboard services using a hash of regular expressions,
# Stashboard service id => Regex matching pingdom check name(s)
services = {
  'api' => /api/i,
  'analyze' => /analyze/i,
  'self-service' => /bizads/i,
  'data-collector' => /data collector/i
}
and iterate over all all Pingdom alerts and for each mapping determine if the service is either up or has had alerts in the past 24 hours,
up_services = services
warning_services = {}

# Synchronize recent pingdom outages over to stashboard
# and determine which services are currently up.
pingdom.checks.each do |check|
  service = services.keys.find do |service|
    regex = services[service]
    check.name =~ regex
  end
  next unless service

  # check if any outages in past 24 hours
  yesterday = Time.now - 24.hours
  recent_outages = check.summary.outages.select do |outage|
    outage.timefrom > yesterday || outage.timeto > yesterday
  end

  # synchronize outage if necessary
  recent_events = stashboard.events(service, "start" => yesterday.strftime("%Y-%m-%d"))
  recent_outages.each do |outage|
    msg = "Service #{check.name} unavailable: " +
    "#{outage.timefrom.strftime(TIME_FORMAT)} - #{outage.timeto.strftime(TIME_FORMAT)}"
    unless recent_events.any? { |event| event["message"] == msg }
      stashboard.create_event(service, "down", msg)
    end
  end

  # if service has recent outages, display warning
  unless recent_outages.empty?
    up_services.delete(service)
    warning_services[service] = true
  end

  # if any pingdom check fails for a given service, consider the service down.
  up_services.delete(service) if check.status == "down"
end
Lastly, if any services are up or should indicate a warning then we update their status accordingly,
up_services.each_key do |service|
  current = stashboard.current_event(service)
  if current["message"] =~ /(Service .* unavailable)|(Service operational but has experienced outage)/i
    stashboard.create_event(service, "up", "Service operating normally.")
  end
end

warning_services.each_key do |service|
  current = stashboard.current_event(service)
  if current["message"] =~ /Service .* unavailable/i
    stashboard.create_event(service, "warning", "Service operational but has experienced outage(s) in past 24 hours.")
  end
end
Note that any manually-entered Stashboard status messages will not be changed unless they match any of the automated messages or if there is a new outage reported by Pingdom. This is intentional to allow overriding automated updates if for any reason, some kind of failure isn't accurately reported.
Curious about what the end result looks like? Take a look at Bizo's status dashboard.
When you click on a specific service, you can see individual outages,
We hope this is useful to somebody out there... and big thanks to the Stashboard authors at Twilio, Matt Todd for creating the pingdom-client gem and Sam Mulube for the stashboard gem. You guys rule!
PS: You can download the full Ruby script from https://gist.github.com/975141.
Subscribe to:
Posts (Atom)


