Monday, December 19, 2011

Get Your Company To Blog More With A Game

At Bizo we try to blog fairly often. But writing blog posts with any degree of frequency at a startup is tough - there are often ten other important tasks that needed to be done yesterday. Finding the time to sit down and write a post when you have features to build, code to review and the occasional meeting is difficult to say the least.

We needed something that would encourage us to blog more frequently, and there's no better way to motivate a bunch of engineers than a game. So during our last Open Source Day we built a Blog Scoreboard that ranks authors based on the number of posts and comments they have. It's setup on our office big screen tv serving as constant reminder that Larry is by a landslide, the king of blogging. For a live demo of the scoreboard and to see just how much Larry is dominating us, checkout the live example here.

Currently we just optimize towards the volume of posts so the points are currently assigned as: 10 points per blog post and 1 point per comment. The weighting scheme is intentionally naive due since this had to be built in a few hours and will undoubtably change as time goes on

The best part about our scoreboard is that it is an open source sinatra (ruby) app, and it works with any Blogger blog! All you have to do is edit a few lines of YAML and you'll have your very own big screen blog scoreboard. You can grab the source code and install instructions on github: https://github.com/jcarver989/blog-scoreboard Happy blogging!

Thursday, December 15, 2011

4 tips from the trenches of Amazon Elastic MapReduce and Hive

Some things you can learn from others, and some things you can only learn from experience.  In an effort to move some knowledge from the latter category into the former, here are four things we've learned the hard way while working with big data flows using Hive on Amazon's Elastic MapReduce:

1. To prevent data loss, make sure Hive knows if it owns the data.

All of our data processing follows a simple pattern: servers write logs to S3, and we use the basic EMR/S3 integration to read this data in our Hive scripts.  A typical table definition could look something like this:

create external table sample_data(d map<string,string>)
  comment 'data logs uploaded from servers'
  row format delimited
    fields terminated by '\004'
    collection items terminated by '\001'
    map keys terminated by '\002'
  stored as textfile
  location 's3://log-bucket/hive/data/files/sample_data/'
;

(The single map column is our way of supporting dynamic columns in Hive.)

The most easily overlooked part of this table definition is the "external" keyword, which tells Hive that the actual underlying data is managed by some other process.  If you forget to add this keyword and later issue a "drop table" command, Hive will happily nuke all of your log files.

This can be especially troublesome while doing ad hoc analysis, as these usually involve interactive queries in the Hive console with a workflow that often involves an exploratory style of development that includes deleting and recreating tables.

One common use pattern where dropping tables appears is when running scripts that include a create statement.  Normally, trying to recreate a table that already exists in Hive will cause an error, so a script may preemptively issue a drop command in case that table already exists.  An alternative is to change the table definition to tell Hive to ignore create statements for preexisting tables:

create external table if not exists sample_data(d map<string,string>)

In the event that you accidentally forget to specify "external" in your table definition, you can add it later by altering the table:

alter table sample_data set tblproperties ('EXTERNAL'='TRUE') ;

Note that the capitalization in the table properties is significant.  Additionally, this feature is only available in Hive 0.6.0+.  (It was present but buggy prior to 0.6.0.)

2. Use a smart partitioning scheme to create flexible views of the data.

Hive supports partitioning, which can be a huge performance win when querying only a subset of the entire dataset.  This is critical when the entire dataset consists of years of request information but you're only interested in analyzing one day of traffic.  To take advantage of this, we upload our data into hourly paths in S3:

s3://log-bucket/log-name/year=${year}/month=${month}/day=${day}/hour=${hour}/${logfile}.log.gz

We would then load this data with the following statements:

create external table sample_data(d map<string,string>)
  comment 'data logs uploaded from servers'
  partitioned by (
    year string, 
    month string, 
    day string, 
    hour string)
  row format delimited
    fields terminated by '\004'
    collection items terminated by '\001'
    map keys terminated by '\002'
  stored as textfile
  location 's3://log-bucket/log-name/'
;
alter table sample_data recover partitions ;

The year/month/day/hour partitions are now available to be used in select/where statements just like columns.

We could (and originally did) just use a single partition column for the entire date; however, using multiple partition columns allows Hive to complete ignore the presence of other partitions.  The above statement will need to recover metadata for 8-9 thousand partitions of data, which (while less troublesome than not partitioning at all) will still require a lot of time and memory.  Multiple partition columns lets us create (for example) a "view" of a single month:

create external table sample_data_2011_12(d map<string,string>)
  comment 'data logs uploaded from servers'
  partitioned by (
    day string, 
    hour string)
  row format delimited
    fields terminated by '\004'
    collection items terminated by '\001'
    map keys terminated by '\002'
  stored as textfile
  location 's3://log-bucket/log-name/year=2011/month=12/'
;
alter table sample_data recover partitions ;

Now Hive only needs to recover 7-8 hundred partitions.  We use a similar strategy for our daily reporting, which makes recovering partition data even faster.

The only time this scheme breaks down is when the report boundaries don't align with the partition boundaries.  In these cases, you can still get the benefits of partitioning by manually adding the partition information to the table.  For example, to do efficient queries on a week of data, we would replace the "recover partitions" statement with a sequence of statements like these (and tweak the table definition to use only a single partition column):

alter table sample_data add partition(day_hour=2011120600) location "s3://log-bucket/log-name/year=2011/month=12/day=06/hour=00/";

3. Use S3 multipart uploads for large objects.

While S3, Elastic MapReduce, and Hive theoretically allow you easily scale your data storage and analytics, we regularly run up against operational limits as our processing requirements grow.  One surprising problem we recently ran into was S3 throttling EMR because our cluster was accessing the source data too quickly.  After some back-and-forth with support, they suggested a workaround of uploading the source objects (which were multiple GB in size and created by a previous EMR job) with multi-part uploads.

Enabling multi-part uploads in EMR is simply a matter of flipping a configuration switch in the cluster configuration.  When starting a cluster from the command line, simply add the following options (taken from the linked documentation):

elastic-mapreduce --create --alive \
--bootstrap-action s3://elasticmapreduce/bootstrap-actions/configure-hadoop \
--bootstrap-name "enable multipart upload" \
--args "-c,fs.s3n.multipart.uploads.enabled=true, \
-c,fs.s3n.multipart.uploads.split.size=524288000"

4. Spot instances can dramatically reduce your data costs.

As our data processing requirements have grown, so have our cluster sizes.  We've found that we can reduce our costs by over 50% by using a mix of on-demand and spot instances.

Each Elastic MapReduce job can have up to three instance groups: master, core, and task.  All data resides on the master and core instances, so jobs can use spot instances to add processing power and additional IO with very little risk.  You can add these instances at startup by simply specifying a bid price:

elastic-mapreduce --create --alive --hive-interactive --hive-versions 0.7 \
--instance-group master --instance-type m1.xlarge --instance-count 1 \
--instance-group core --instance-type m1.xlarge --instance-count 9 \
--instance-group task --instance-type m1.xlarge --instance-count 90 --bid-price 0.25 

For ad hoc queries, I've also found it easy to prototype my job on a subset of data using only the master and core instances, then add the task instances once I'm satisfied that the query is correct.  New task instances are available as Hadoop workers as soon as they're added to the cluster, even if you're already running your MapReduce job.  You can modify the size of the task group using the command-line client:

elastic-mapreduce --jobflow j-xxxxxxxxxxxxx --add-instance-group task  --instance-type m1.xlarge --instance-count 90 --bid-price 0.25

elastic-mapreduce --jobflow j-xxxxxxxxxxxxx --set-num-task-group-instances 90

Note that while the size of the task group can be changed, you cannot modify the instance type or the bid price after the task group is created.

Tuesday, December 13, 2011

Promises in Javascript/Coffeescript

This happens often. You’re humming along writing some awesome Javascript code. At first everything is neat and organized. Then you add a feature here, an AJAX call there and before your once lovely codebase has turned into callback spaghetti.

One scenario where this can become particularly nasty is when you have an arbitrary number of asynchronous tasks, one of which cant run until all the others have completed. Suppose for example you are creating a page that displays information on your organization’s engineering team and open source projects hosted on Github. This might require a few api calls to Github (eg. one to get the repositories, another to get the team members) that can be executed in parallel. We could just append the information to the DOM as each api call finishes, but it would be nice to avoid pieces of the site popping in at different times. Instead it would be ideal if we made the api calls to Github and only after both api calls had completed would we render the information to the DOM. The problem is that in Javascript trying to implement this can get quite messy.

A Bad Solution

The issue here is knowing when it is safe to execute the task that renders the Github information to the page. One strategy might be to store the results from each api call in an array and then wait for a set amount of time before drawing the page.

results = []

githubApiCallOne (response) -> 
  results.push(response)

githubApiCallTwo (response) ->
  results.push(response)

setTimeout(() ->
  drawPage(results)
, 5000)

This turns out to be a poor solution as we can either end up waiting too little, in which case the program would fail or we could set the timeout too high making our users wait longer than necessary to load our page.

Promises to The Rescue

Fortunately there is a better way to implement our Github page. Using a construct called a Promise (sometimes called a Future) allows us to elegantly handle these types of situations. Using promises we can turn our code into something like this:

Promise.when(
  githubApiCallOne(),
  githubApiCallTwo()
).then((apiCallOneData, apiCallTwoData) ->
  renderPage(apiCallOneData, apiCallTwoData)
)

The basic idea is that our async api calls will now return a promise object that functions much like an IOU – they can’t give us the results of the api call immediately but they (probably) can at some time in the future. The Promise.when method takes an arbitrary number of promise objects as parameters and then executes the callback in the “then” method once every promise passed to “when” has been completed.

To do this, our api calls would have to be modified to return promise objects, which turns out to be trivial. Such an implementation might look like so:

githubApiCallOne = () ->
  promise = new Promise()

  # async call
  ajaxGet("/repositories", (repository_data) ->
    # fulfill the promise when async call completes
    promise.complete(repository_data)
  )

  return promise

githubApiCallTwo = () ->
  promise = new Promise()

  ajaxGet("/users", (user_data) ->
    promise.complete(user_data)
  )

  return promise

The githubApiCallOne and githubApiCallTwo make their ajax calls but return a promise object immediately. Then when the AJAX calls complete, they can fulfill the promise objects by calling “complete” and passing in their data. Once both promise objects have been fulfilled the callback passed to Promise.then is executed and we render the page. With jQuery

The good news is if you’re already using jQuery you get Promises for free. As of jQuery 1.5 all the $.ajax methods (eg. $.get, $.post etc) return promises which allows you to do this:

promise1 = $.get "http://foo.com"
promise2 = $.post "http://boo.com"

$.when(promise1, promise2)
 .then (promise1Result, promise2Result) ->
  # do something with the data

What if I cant use jQuery?

Rolling a custom implementation of Promises isn’t recommended for production code but might be necessary if you write a lot of 3rd party Javascript and/or just want to try it for fun. Here’s a very basic implementation to get you started. Error handling, exceptions etc are left as an exercise to the reader.

class Promise
  @when: (tasks...) ->
    num_uncompleted = tasks.length 
    args = new Array(num_uncompleted)
    promise = new Promise()

    for task, task_id in tasks
      ((task_id) ->
        task.then(() ->
          args[task_id] = Array.prototype.slice.call(arguments)
          num_uncompleted--
          promise.complete.apply(promise, args) if num_uncompleted == 0
        )
      )(task_id)

    return promise
    
  constructor: () ->
    @completed = false
    @callbacks = []

  complete: () ->
    @completed = true
    @data = arguments
    for callback in @callbacks
      callback.apply callback, arguments

  then: (callback) ->
    if @completed == true
      callback.apply callback, @data
      return

    @callbacks.push callback

Sharp eyed readers might notice that the code inside the for loop in the Promise.when method looks a bit strange. You might notice that I’m wrapping the promise’s “then” method call inside of a self executing function that passes in the task_id variable. This funkiness is actually required due to the way that closures work in Javascript. If you attempt to reference the task_id without the self executing closure, you’ll actually get a reference to the task_id iterator instead of a copy – which means by the time your “then” methods execute the loop will have finished iterating and all the task_ids will share the same value! To get around this you have to create a new scope and pass in the iterator so we end up with a copy of the value instead of a reference.

And Finally an example using the supplied Promise class to prove it works:

delay = (string) ->
  promise = new Promise()
  setTimeout(() -> 
    promise.complete string
  ,200)
  return promise

logEverything = (fooData, barData, bazData) -> 
  console.log fooData[0], barData[0], bazData[0]

window.onload = () ->
  Promise.when(
    delay("foo"),
    delay("bar"),
    delay("baz")
  ).then logEverything

Thursday, December 8, 2011

Monday, November 21, 2011

SVG Charts, Done Right.

Here at Bizo we like many companies use charts visualizations in our products. They are fantastic tools for making the lives of our users easier. But unfortunately most charting libraries aren't that great. Some, like Google's visualizations have overly complex apis where you have to contort your data into intermediary objects and zero pad data. Others like flot have poor default options that require you to override almost every option just to get something that looks halfway presentable.

Our initial requirements for a charting library seemed pretty simple:

  1. Good looking defaults
  2. An api that didn't force a developer to do mental gymnastics just to load in data
  3. IE support
  4. No flash

But after looking around for a while it became apparent that none of the existing libraries really met our needs. Every library we looked at fell flat in one of these four requirements. So I set out to write a charting library from scratch during nights and weekends. Eleven days later version 1.0 of Raphy Charts was born. Raphy Charts (http://jcarver989.github.com/raphy-charts/) an html5/canvas charting library built ontop of Raphael (http://raphaeljs.com/) that includes the following features:

  • Great looking defaults (see example below)
  • Easy api that allows you to pass a normal 2d Javascript array of x,y points without the need to pad your x-labels.
  • IE support for version 7+
  • SVG or VML (older IEs) charts with no Flash.
Get Raphy Charts

Tuesday, November 1, 2011

5 minute web framework review : reading params

Through various experiments, hackdays, conversations with other developers, etc. I've found myself experimenting with a few different web frameworks. The focus has been mostly simple webapps / simple REST services written in scala that return html or json. I thought it might be interesting to dive into some focused comparisons in a series of posts.

This is not an exhaustive comparison. I'm going to be focusing on the frameworks I've found the most interesting for my use cases lately, namely scalatra, play, and jersey.

For the first comparison, I want to focusing on reading query and path parameters. Parameter de-serialization has always been a pain. The web uses strings, and strings are messy. Are my required params specified? Are they the right types? Can I easily convert to the types my program expects? Do they pass my validation? etc.

Let's look at how each framework helps us deal with these common concerns.

jersey

I like jersey. It's a reference implementation of JSR-311: Java API for RESTful Web Services. It's also quite nice to work with in scala.

query parameters

With jersey, query parameters are simply specified as method parameters. Simple types are automatically converted, and it's easy to specify defaults. It will also automatically call converters for use with your own complex types. Unfortunately, you must use annotations to map query param names to method params.

 def doGet(@QueryParam("name") name: String,
           @QueryParam("count") @DefaultValue("2") count: Int): String = {
   "name: %s, count: %d\n".format(name, count)
 }

It works pretty much as you'd expect:

$ curl "http://localhost:8080/hello?name=larry&count=5"
name: larry, count: 5

If the types aren't correct, you'll get a 404:

curl "http://localhost:8080/hello?name=larry&count=a" -D -
HTTP/1.1 404 Not Found

path parameters

Path parameters in jersey work pretty much the same way as query params, i.e. typed, with default values and appearing as method arguments. Additionally you can do some simple validation using regular expressions. Their names and path location are specified when defining the route.

@Path("/hello/{userid}")
class Hello {
  def doGet(@PathParam("userid") id: Int)
}

Here's a different example showing some simple regex validation support:

@Path("/hello/{username: [a-zA-Z][a-zA-Z_0-9]+}")
And, again, if the path doesn't match your regex, or type, you will get a 404.

other params

There are also @CookieParam, @HeaderParam annotations for reading cookie and header values, as well as support for pulling in session or request variables using @Context or custom annotations (e.g. I've created @IpAddress for pulling in the ip).

overall thoughts

I really like the automatic de-serialization and type conversion, and having the framework handle errors for incompatible parameters automatically.

I also like the POJO mindset. It's just a function with arguments like any other. All else being equal, this makes testing in any framework super easy.

The annotations do seem a little noisy, especially having to specify the parameter name. I think we can do better.

scalatra

scalatra is also very nice for simple apps, and I've quickly become a fan of scalate which it uses for templating.

When it comes to dealing with parameters though, it feels like a step back. Everything is strings. The fact that it's scala makes it easier to deal with, but it does feel like the framework could go a little further to help you out.

query parameters

To read query parameters, you use the params method from ScalatraServlet. params is a MultiMapHeadView[String, String]. So yes, you are back to dealing with Strings (or a Seq[String] if using multiParams).

E.g.

get("/hello") {
  val name:String = params.getOrElse("name", halt(400))
  val count:Int = params.getOrElse("count", "2").toInt

  "name: %s, count: %d\n".format(name, count)
}
Calling this path without a name will generate a 400, as expected:
$ curl "http://localhost:8080/hello" -D - 
HTTP/1.1 400 Bad Request
If you don't specify count, you will get the default of 2. However, if you specify a non-int, you'll get a 200 where the contents are the stack trace for the toInt call. Again, your validation is all manual -- if you want better type validation, it's up to you.
2:~ larry$ curl "http://localhost:8080/hello?name=larry&count=a" -D -
HTTP/1.1 200 OK
…
<p>
java.lang.NumberFormatException: For input string: "a"
</p>

path parameters

Path params work exactly the same way (including being accessed in params), and are named as part of your route:

get("/hello/:name/:count") {
  val name:String = params.getOrElse("name", halt(400))
  val count:Int = params.getOrElse("count", "2").toInt

  "name: %s, count: %d\n".format(name, count)
}
$ curl "http://localhost:8080/hello/larry/5"
name: larry, count: 5

overall thoughts

The manual de-serialization seems a little dated, and gets old quick. Scala does make it nicer than it would be in java, since you can do things like params.getOrElse("name", halt(400)), but I would like to see more.

I also miss the POJO mindset… when testing you need to do whatever additional setup is necessary to serialize your params as strings and stick them in a map.

I guess I also don't like that barring convention, there's no formal definition of what parameters you are expecting and what their types are - maybe you are calling params.get somewhere in the middle of your method..

play

play the framework feels a little heavy compared to jersey and scalatra, but if definitely shines when it comes to dealing with parameters.

query parameters

Query parameters in play are done really well. It's almost perfect.

def hello(name: String, count: Int = 2) = {
  "name: %s, count: %d\n".format(name, count)
}
$ curl "http://localhost:9000/hello?name=larry"
name: larry, count: 2
You can even use Option for parameters that may be available:
def hello(name: Option[String], count: Int = 2) = {
  "name: %s, count: %d\n".format(name.getOrElse("anon"), count)
}

One problem is that type conversion errors are silently ignored, and defaults will be used:

$ curl "http://localhost:9000/hello?name=larry&count=a"
name: larry, count: 2
Okay, so they're not really ignored. If you call Validation.hasErrors, it will return true, and you can discover the error. This is the same mechanism you need to use to mark parameter as required:
def hello(name: String, count: Int = 2) = {
  Validation.required("name", name)
  if (Validation.hasErrors) {
    // handle error

path parameters

Path parameters work the same way. They're defined with placeholders in your route, and automatically passed in as the correct argument. In play, routes are defined external to your code, in a routes file. E.g.

GET /hello/{name} Application.hello
Our method looks the same as the first Query param example. Calling it looks like this:
 
$ curl "http://localhost:9000/hello/larry"
name: larry, count: 2
In the case of path parameters, we will get a 404 if missing the parameter (since it won't match our route).
$ curl "http://localhost:9000/hello/" -D -

HTTP/1.1 404 Not Found

overall thoughts

Overall I think parameters in play are done really well.

Like jersey, I really appreciate the POJO approach. play does it even better by eliminating the extra annotations and leveraging scala's default argument support.

Validation does seem a little clunky, though. It seems like more could be done there.

Thursday, October 13, 2011

Advanced Amazon Web Services Meetup


Bizo Engineering, with the help of Amazon Web Servies, has developed a new meetup in San Francisco that focuses on Advanced Amazon Web Services topics. The main concept is that there are many companies who have been operating on AWS for a number of years and have significant experience but do not have a forum to discuss more advanced issues and architectures.

The next meetup is on Tuesday October 18th at 7pm in San Francisco (more details). We have speakers from Bizo, Twilio and Amazon Web Services.

We look forward to meeting other AWS companies and sharing stories from the trenches. Hope to see you there!

Monday, October 10, 2011

the story of HOD : ahead of its time, obsolete at launch

Last week we shut down an early part of the bizo infrastructure : HOD (Hadoop on Demand). I thought it might be fun to look back on this project a bit.

We've been using AWS as long as bizo has been around, since early 2008. Hadoop has always been a big part of that. When we first started, we were mostly using a shared hadoop cluster. This was kind of a pain for job scheduling, but also was mostly wasteful during off-peak hours… Thus, HOD was born.

From its documentation, "The goal of HOD is to provide an on demand, scalable, sandboxed infrastructure to run Hadoop jobs." Sound familiar? HOD was developed late September and October of 2008, and launched for internal use December 12th, 2008. Amazon announced EMR April of 2009. It's amazing how similar they ended up being… especially since we had no knowledge of EMR at the time.

Even though HOD had a few nice features missing from EMR, the writing was on the wall. For new tasks, we wrote them for EMR. We slowly migrated old reports to EMR when they needed changes, or we had the time.

Architecture

HOD borrowed quite liberally from the design of Alexa's GrepTheWeb.

Users submitted job requests to a controller which managed starting exclusive hadoop clusters (master, slaves, hdfs), retrieving job input from S3 to HDFS, executing the job (hadoop map/reduce), monitoring the job, storing job results, and shutting down the cluster on completion. Job information and status was stored in SimpleDB, S3 was used for job inputs and outputs, and SQS was used to manage the job workflow.

Job Definition

Jobs were defined as thrift structures:
 struct JobRequest {
   1: JobConf job = {},
   2: i32 requested_nodes = 4, // requested number of hadoop slaves
   3: string node_type = "m1.large", // machine size
   4: i32 requested_priority, // job priority
   5: string hadoop_dist, // hadoop version e.g. "0.18.3"
   6: set depends_on = [], // ids of job dependencies
   
   7: list on_success = [], // success notification
   8: list on_failure = [], // failure notification
   9: set flags = [] // everyone loves flags
 }

 struct JobConf {
   1: string job_name,
   2: string job_jar,  // s3 jar path
   3: string mapper_class,
   4: string combiner_class,
   5: string reducer_class,

   6: set job_input,  // s3 input paths
   7: string job_output,  // s3 output path (optional)
   
   8: string input_format_class,
   9: string output_format_class,
   
   10: string input_key_class,
   11: string input_value_class,
   
   12: string output_key_class,
   13: string output_value_class,
   
   // list of files for hadoop distributed cache
   14: set user_data = [],
   
   15: map other_config = {}, // passed directly JobConf.set(k, v)
 }
You'll notice that dependencies could be specified. HOD could hook up the output of 1 or more jobs into the input of a job and wouldn't run the job until all of its dependencies have successfully completed.

User Interaction

We had a user program, similar to emr-client that helped construct and job jobs, e.g.:
JOB="\
 -m com.bizo.blah.SplitUDCMap \
 -r com.bizo.blah.UDCReduce \
 -jar com-bizo-release:blah/blah/blah.jar
 -jobName blah \
 -i com-bizo-data:blah/blah/blah/${MONTH} \
 -outputKeyClass org.apache.hadoop.io.Text \
 -outputValueClass org.apache.hadoop.io.Text \
 -nodes 10 \
 -nodeType c1.medium \
 -dist 0.18.3
 -emailSuccess larry@bizo.com \
 -emailFailure larry@bizo.com \
"

$HOD_HOME/bin/hod_submit $JOB $@
There was also some nice support for looking at jobs, either by status or by name: As well as support for viewing job output, logs, counters, etc.

Nice features

We've been very happy users of Amazon's EMR since it launched in 2009. There's nothing better than systems you don't need to support/maintain yourself! And they've been really busy making EMR more easy to use and adding great features. Still, there are a few things I miss from HOD.

Workflow support

As mentioned, HOD had support for constructing job workflows. You could wire up dependencies amount multiple jobs. E.g. here's an example workflow (also mentioned in this blog previously under hadoop-job-visualization).

It would be nice to see something like this in EMR. For really simple workflows, you can sometime squeeze them into a single EMR job as multiple steps, but that doesn't always make sense and isn't always convenient.

Notification support

HOD supported notifications directly. Initially just email notifications, but there was a plugin structure in place with an eye towards supporting HTTP endpoint, and SQS notifications.

Yes, this is possible by adding a custom EMR job step at the end that checks the status of itself and sends an email/failure notification… But, c'mon, why not just build in easy SNS support? Please?

Counter support

Building on that, HOD had direct support/understanding for hadoop counters. When processing large volumes of data, they become really critical in tracking the health of your reports over time. This is something I really miss. Although, it's less obvious how to fold this in with Hive jobs, which is how most of our reports are written these days.

Arbitrary Hadoop versions

HOD operated with straight hadoop, so it was possible to have it install an arbitrary version/package just by pointing it to the right distribution in S3.

Since Amazon isn't directly using a distribution from the hadoop/hive teams, you need to wait for them to apply their patches/changes and can only run with versions they directly support. This has mostly been a problem with Hive, which moves pretty quickly.

It would be really great if they could get to a point where their changes have been folded back into the main distribution.

Of course, this is probably something you can do yourself, again with a custom job step to install your own version of Hive… Still, they have some nice improvements, and again, it would be nice if it were just a simple option to the job.

The Past / The Future

Of course, HOD wasn't without its problems :). It's become a bear to manage, especially since we pretty much stopped development / maintenance (aside from rebooting it) back in 2009. It was definitely with a sigh of relief that I pulled the plug.

Still, HOD was a really fun project! It was an early project for me at Bizo, and it was really amazing how easy it was to write a program that starts up machines! and gets other programs installed and running! Part of me wonders if there isn't a place for an open source EMR-like infrastructure somewhere? Maybe for private clouds? Maybe for people who want/need more control? Or for cheapskates? :) (EMR does cost money).

Or maybe HOD v2 is just some wrappers around EMR that provides some of the things I miss : workflow support, notifications, easier job configuration…

Something to think about for that next hack day :).

Wednesday, October 5, 2011

Writing better 3rd party Javascript with Coffeescript, Jasmine, PhantomJS and Dependence.js

Here at Bizo we recently underwent a major change to our Javascript tags that’s used in our free analytics product (http://www.bizo.com/marketer/audience_analytics). Our code gets loaded by millions of visitors each month across thousands of web sites; so our Javascript has to run reliably in just about any browser on any page.

The Old Javascript:

Unfortunately our codebase had accumulated about three years of cruft,
resulting in a single monolithic Javascript file. The file contained
a single closure, over 600 lines long, with all kinds of edge cases,
some of which no longer existed. Since you can’t access anything in a
closure from the outside, writing unit tests was nearly impossible and
the code had suffered as a result.

That’s not to say we had no tests – there were several selenium tests
that tested functionality at a high level. The problem however was
making the required changes was going to be a time consuming (and
somewhat terrifying) process. The selenium tests provided a very slow
testing feedback loop and debugging a large closure comes with it’s
own challenges. If it’s scary changing your production code, then
you’re doing something wrong.

Modularity and Dependency Management


So we decided to do a complete overhaul and rewrite our Javascript
tags in CoffeeScript (smaller code base with clearer code). The
biggest problem the original code had was that it wasn’t modular and
thus difficult to test. Ideally we wanted to split our project into
multiple files that we could unit test. To do this we needed some
kind of dependency management system for Javascript, which in 2011
surprisingly isn’t standardized yet. We looked at several projects but
none of them really met our needs. Our users are quite sensitive about
the number of http requests 3rd party Javacript makes so solutions
that load several scripts in parallel weren’t an option (ex.
Requirejs). Others like Sprockets were close but didn’t quite support
everything we needed.

We ended up writing Dependence.js, a gem to manage our Javascript
dependencies. Dependence will compile all your files in a module into
a single file. Features include javascript and/or Coffeescript
compilation, dependency resolution (via a topological sort your
dependency graph), allowing you to use an “exports” object for your
modules interface, and optional compression using Google’s Closure
compiler. Check it out on github:
(http://github.com/jcarver989/dependence.js)

Fast Unit testing with Phantom.js

Another way we were looking to improve our Javascript setup was to
have a comprehensive suite of unit tests. After looking at several
possibilities we settled on using the Jasmine test framework
(http://pivotal.github.com/jasmine/) in conjunction with PhantomJS (a
headless webkit browser). So far using Jasmine and PhantomJs together
has been awesome. As our Javascript is inherently DOM coupled, each of
our unit tests executes in a separate iframe (so each test has its own
separate document object). 126 unit tests later the entire suite runs
locally in about 0.1 seconds!

Functional Testing with Selenium

Our functional tests are still executed with Selenium webdriver.
Although there are alternative options such as HtmlUnit, we wanted to
test our code in real browsers and for this Selenium is still the best
option around. A combination of capybara and rspec make for writing
functional tests with a nicer api than then raw selenium. A bonus is
that capybara allows you to swap out selenium in favor of another
driver should we ever want to switch to something else. Lastly a
custom gem for creating static html fixtures allows us to
programmatically generate test pages for each possible configuration
option found in our Javascript module. You can find that here:
(http://github.com/jcarver989/js-fixtures).

Wrapping up

The new code is far more modular, comprehensively tested and way
easier to extend. Overall working with Dependence.js, CoffeeScript,
PhantomJs, Capybara, Rspec and Selenium has been a workflow that works
great for us. If you have a different workflow that you like for
Javascript projects, let us know!

Wednesday, August 24, 2011

Cloudwatch metrics revisited

In a previous post, I discussed our initial usage of cloudwatch custom metrics. Since then, we've added more metrics and changed how we're recording them, so I thought it might be helpful to revisit the topic.

Metric Namespaces

Initially we had a single namespace per application. We decided that the stage should be included in the namespace. E.g. api-web-prod, api-web-dev. It seems to make sense to keep metrics from different stages completely separate, especially if you are using them for alerting or scaling events.

Metric Regions

When we started, we were logging all metrics to us-east (may have been a requirement of the beta?). Going forward, it made sense to log to the specific region where the events occurred. There's a little more work if you want to aggregate across regions, but it matches the rest of our infrastructure layout better. Also, if you want to use metrics for auto-scaling events, it's a requirement.

Dropping InstanceId dimensions (by default)

This is something we are currently working on rolling out. When we first started logging events, we would include a metric update tagged with the InstanceId. This mirrors how the built-in AWS metrics work. It seemed like it would be useful to be able to "drill down" when investigating an issue, i.e. the Maximum CPU utilization in this group is at 100%, okay, which instance is it?

In practice, we have started to question the utility versus cost, especially for custom metrics. When you run large services with auto-scaling, you end up generating a lot of metrics for very transient instances. Since the cost structure is based on the number of unique metrics used, this can really add up.

For some numbers, looking at the output of mon-list-metrics in us-east-1 only, we have 31,888 metrics with an InstanceId dimension! That's just for the last 2 weeks. If we were paying for all of those (luckily most of them are for built-in metrics), it would cost us $15k for those 2 weeks of metrics on very transient instances.

It has been useful to have InstanceId granularity metrics in the past, and in a perfect world maybe we'd still be collecting them, but with the current price structure it's just too expensive for most of our (auto-scaled) services.

Metric Dimensions revisited

When we first started using cloudwatch custom metrics, we would log the following dimensions for each event:
  • Version, e.g. 124021 (svn revision number)
  • Stage, e.g. prod
  • Region, e.g. us-west-1
  • Application, e.g. api-web
  • InstanceId, e.g. i-201345a
We can drop Stage and Region due to our namespace and region changes above. As mentioned, we've also decide to drop InstanceId for most of our services. This makes our current list of dimension defaults:
  • Version, e.g. 124021 (svn revision number)
  • Application, e.g. api-web
We're still tracking stage and region, based on the namespace or region, they just don't need to be expressed as dimensions.

More Metrics!

One of our developers, Darren, put together a JMX->Cloudwatch bridge. Each application can express which JMX stats it would like to export via a JSON config file. Here's a short except that will send HeapMemoryUsage to cloudwatch every 60 seconds:
  {
    "objectName" : "java.lang:type=Memory",
    "attribute" : "HeapMemoryUsage",
    "compositeDataKey" : "used",
    "metricName" : "HeapMemoryUsage",
    "unit" : "Bytes",
    "frequency" : 60,
  },
I'm sure the list will grow, but some of the metrics we've found most useful so far:
  • NonHeapMemoryUsage
  • HeapMemoryUsage
  • OpenFileDescriptorCount
  • SystemLoadAverage
  • ThreadCount

I'm hoping Darren will describe the bridge in more detail in a future post. It's made it really easy for applications to push system metrics to cloudwatch.

Of course, we're also sending a lot of application specific event metrics.

Homegrown interfaces

The AWS cloudwatch console is really slow. It also only seems like it will load 5,000 metrics. Our us-east "AWS/EC2" namespace alone has 28k metrics. Additionally, you can only view metrics for a single region at a time. We just haven't had a lot of success with the web console.

We've been relying pretty heavily on the command line tools for investigation, which can be a little tedious.

We've also written some scripts that will aggregate daily metrics for each app and insert them into a google docs spreadsheet to help track trends.

For our last hack day, I started working on a (very rough!) prototype for a custom cloudwatch console.

The app is written using play (scala) with flot for the graphs.

It heavily caches the namespace/metric/dimension/value hierarchies, and queries all regions simultaneously. It certainly feels much faster than the built-in console.

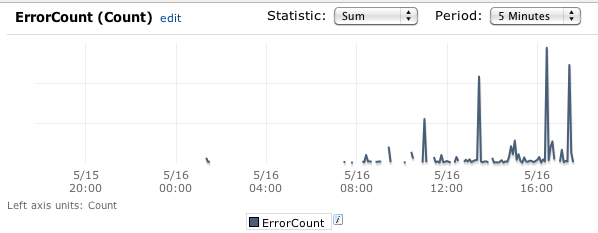
It's great just being able to quickly graph metrics by name, but my main motivation for this console was to provide a place where we could start to inject some intelligence about our metrics. The cloudwatch interface has to be really generic to support a wide range of uses/metrics. For our metrics, we have a better understanding of what they mean and how they're related. E.g. If the ErrorCount metric is high, we know which other metrics/dimensions can help us drill down and find the cause. I'm hoping to build those kinds of relationships into this dashboard.

Summary

So that's how we're currently using cloudwatch at bizo. There are still some rough edges, but we've been pretty happy with it. It's really easy to log and aggregate metric data with hardly any infrastructure.

I'd love to hear any other experiences, comments, uses people have had with cloudwatch.

Friday, August 19, 2011

Report delivery from Hive via Google Spreadsheets

At Bizo, we run a number of periodically scheduled Hive jobs produce a high level summary as just a few (often, just one) row of data. In the past, we’ve simply used the same delivery mechanism as with larger reports; the output is emailed as a CSV file to the appropriate distribution list. This was less than ideal for a number of reasons:


  1. Managing the distribution lists is difficult. We either needed to create a new list for each type of report, giving us a lot of lists to manage, or just send reports to a generic distribution list, resulting in a lot of unnecessary emails to people who weren’t necessarily interested in the report.

  2. Handling the historical context is manual; the report needs to pull in past results to include in the output or recipients of the output need to find older emails to see trends appear.

  3. Report delivery required an additional step in the job workflow outside of the Hive script.

With the GData storage handler, we now just create a Google Spreadsheet, add appropriate column headers, and do something like this in our script:


add jar gdata-storagehandler.jar ;

create external table gdata_output(
day string, cnt int, source_class string, source_method string, thrown_class string
)
stored by 'com.bizo.hive.gdata.GDataStorageHandler'
with serdeproperties (
"gdata.user" = "user@bizo.com",
"gdata.consumer.key" = "bizo.com",
"gdata.consumer.secret" = "...",
"gdata.spreadsheet.name" = "Daily Exception Summary",
"gdata.worksheet.name" = "My Application",
"gdata.columns.mapping" = "day,count,class,method,thrown"
)
;

This appends whatever data is written to the table to the specified spreadsheet.


The source code is available here. If you’re running your jobs on Amazon’s Elastic MapReduce, you can access the storage handler by adding the following line to your Hive script:


add jar s3://com-bizo-public/hive/storagehandler/gdata-storagehandler-0.1.jar ;

Note that the library only supports 2-legged OAuth access to Google Apps for Domains, which needs to be enabled in your Google Apps control panel.

Friday, August 12, 2011

Bizo dev team @ TechShopSF

IMG_0887

Every quarter we have an "all hands" week, where the entire company comes to SF (the Bizo team is spread out across the country).

As part of this, we typically spend a day as a development team going over previous accomplishments and upcoming projects, as well as discussing our development process, architecture, etc.

We also spend some time making cool stuff! Last time around we had an internal Arduino workshop. Each developer got an Arduino and various components, and we went through a bunch of exercises from Getting Started with Arduino. We ended the day getting Wii controllers hooked up to our Arduinos (can't beat that).

This time around, we decided to head over to the SF Techshop and learn how to screen print.

We ended up with some great shirts:

IMG_0898

They use a really cool process there, where you use a vinyl cutter to create a stencil for your artwork, which you can then just apply to your screen.

It was a lot of fun, and I think we all learned a lot. Special thanks to our instructor, Liz, as well as Devon at TechShop for helping us get this set up.

Check out some more shirts in this photo set.

Wednesday, June 1, 2011

MongoSF follow-up and contest winners

Thanks for stopping by and meeting the Bizo engineering team at MongoSF. We had a great time meeting everyone at the conference and the after-party. Stay in touch! As part of our conference sponsorship, we were able to include a small card in the conference bags. We are hiring, so we decided to use the space to talk a bit about the engineering team. On the back of the card, we included a small puzzle (click though for the full version): If you successfully completed the puzzle, you landed here, with a chance to enter some pirate jokes and win an Amazon gift card. Congratulations to the winners:
  • Y. Wayne H.
  • Huy H.
  • Dan N.
Like I said, we are hiring! We're looking for smart, motivated people who get stuff done. To learn more about the team, check out our mini engineering team site. If you would like to talk more, please get in touch! Finally, here are some of our favorite pirate jokes from the contest:
How does a pirate do calculus?
By taking a derivative with respect to Arrrrrrrrrrrrrrrrrrrr!!!
Where is the hidden treasure map of Silicon Valley?
Legend has it that Captain Zukarrrrburg hides it in his Subvarrrrsion Reparrrrsitory ol' matey!

Sunday, May 22, 2011

Bizo @ MongoSF

MongoSF badge 210x140 This Tuesday, May 24th the Bizo dev team will be attending the MongoSF conference. Hope to see you there. We're also sponsoring the after-party at Oz Lounge. Stop by, say "hello," and let us buy you a drink!

Thursday, May 19, 2011

Cloudwatch custom metrics @ Bizo

Now that Cloudwatch Custom Metrics are live, I wanted to talk a bit about how we're using them here at Bizo. We've been heavy users of the existing metrics to track requests/machine counts/latency, etc. as seen here. We wanted to start tracking more detailed application-specific metrics and were excited to learn about the beta custom metric support.

Error Tracking

The first thing we decided to tackle tracking were application errors. We were able to do this across our applications pretty much transparently by creating a custom java.util.logging.Handler. Any application log message that crosses the specified level (typically SEVERE, or WARNING) will be logged to cloudwatch. Api errors For error metrics, we use "ErrorCount" as the metric name, with the following dimensions:
  • Version, e.g. 124021 (svn revision number)
  • Stage, e.g. prod
  • Region, e.g. us-west-1
  • Application, e.g. api-web
  • InstanceId, e.g. i-201345a
  • class, e.g. com.sun.jersey.server.impl.application.WebApplicationImpl
  • exception, e.g. com.bizo.util.sdb.RuntimeDBException
Each application has its own cloudwatch namespace. This setup allows us to track error counts and rates across our applications/versions/regions, as well as get alerts when they reach specific thresholds.

Other Application Metrics

We expose a simple MetricTracker interface in our applications:
interface MetricTracker {
  void track(String metricName, Number value, List<Dimension> dimensions);
}
The implementation handles internally buffering/aggregating the metric data, and then periodically sending batches of cloudwatch updates. This allows developers to quickly add tracking for any metric they want. Note that with cloudwatch, there's no setup required, you just start tracking.

Wishlist

It's incredibly easy to get up and running with cloudwatch, but it's not perfect. There are a couple of things I'd like to see:
  • More data - CW only stores 2 weeks of data, which seems too short.
  • Faster - pulling data from CW (both command line and UI) can be really slow.
  • Better suport for multiple dimensions / drill down.
Cloudwatch does allow you to track against multiple dimensions, but it doesn't work as you'd probably expect. They're really treated as a single dimension. E.g. If you track against stage=prod,version=123, you can ONLY retrieve stats by querying against stage=prod,version=123. Querying against stage=prod only or version=123 only will not produce any results. You can work around this in your application, by submitting data for all permutations that you want to track against (our MetricTracker implementation works this way). It would be great if couldwatch supported this more fully, including being able to drill down/up in the UI.

Alternatives

We didn't invest too much time into exploring alternatives. It seems like running an OpenTSDB cluster, or something like statds would get you pretty far in terms of metric collection. That's only part of the story though, you would also definitely want alerting, and possible service scaling based on your metrics.

Overall Impressions

We continue to be excited about the custom metric support in Cloudwatch. We were able to get up and running very quickly with useful reports and alarms based on our own application metrics. For us, the clear advantage is that there's absolutely no setup, management or maintenance involved. Additionally, the full integration into alarms, triggers, and the AWS console is very key.

Future Use

We think that we may be able to get more efficient machine usage by triggering scaling events based on application metric data, so this is something we will continue to explore. It's easy to see how the error tracking we are doing can be integrated into a deployment system to allow for more automated rollout/rollback by tracking error rate changes based on version, so I definitely see us heading in that direction.

Monday, May 16, 2011

Synchronizing Stashboard with Pingdom alerts

First, what's Stashboard? It's is an open-source status page for cloud services and APIs. Here's a basic example:
Alright, now what's Pingdom? It's a commercial service for monitoring cloud services and APIs. You define how to "ping" a service, and Pingdom periodically checks if the service is responding to the ping request and if not, sends email or SMS alerts.


See the connection? At Bizo, we've had Stashboard deployed on Google's AppEngine for a while but we were updating the status of services manually -- only when major outages happened.

Recently, we've been wanting for something more automated and so we decided to synchronize Stashboard status with Pingdom's notification history and came out with the following requirements:
  1. Synchronize Stashboard within 15 minutes of Pingdom's alert.
  2. "Roll-up" several Pingdom alerts into a single Stashboard status (i.e., for a given service, we have several Pingdom alerts covering different regions around the world but we only want to show a single service status in Stashboard)
  3. If any of the related Pingdom alerts indicate a service is currently unavailable, show "Service is currently down" status.
  4. If the service is available but there have been any alerts in the past 24 hours, show "Service is experiencing intermittent problems" status.
  5. Otherwise, display "Service is up" status.
There are several ways we could have implemented this. We initially thought about using AppEngine's Python Mail API but decided against it since we're not familiar enough with Python and we didn't want to customize Stashboard from the inside. We ended up doing an integration "from the outside" using a cron job and a Ruby script that uses the stashboard and the pingdom-client gems.

It was actually pretty simple. To connect to both services,

require 'pingdom-client'
require 'stashboard'

pingdom = Pingdom::Client.new pingdom_auth.merge(:logger => logger)

stashboard = Stashboard::Stashboard.new(
  stashboard_auth[:url],
  stashboard_auth[:oauth_token],
  stashboard_auth[:oauth_secret]
)

then define the mappings between our Pingdom alerts and Stashboard services using a hash of regular expressions,

# Stashboard service id => Regex matching pingdom check name(s)
services = {
  'api' => /api/i,
  'analyze' => /analyze/i,
  'self-service' => /bizads/i,
  'data-collector' => /data collector/i
}

and iterate over all all Pingdom alerts and for each mapping determine if the service is either up or has had alerts in the past 24 hours,

up_services = services
warning_services = {}

# Synchronize recent pingdom outages over to stashboard
# and determine which services are currently up.
pingdom.checks.each do |check|
  service = services.keys.find do |service|
    regex = services[service]
    check.name =~ regex
  end
  next unless service
  
  # check if any outages in past 24 hours
  yesterday = Time.now - 24.hours
  recent_outages = check.summary.outages.select do |outage|
    outage.timefrom > yesterday || outage.timeto > yesterday
  end
  
  # synchronize outage if necessary
  recent_events = stashboard.events(service, "start" => yesterday.strftime("%Y-%m-%d"))
  recent_outages.each do |outage|
    msg = "Service #{check.name} unavailable: " +
    "#{outage.timefrom.strftime(TIME_FORMAT)} - #{outage.timeto.strftime(TIME_FORMAT)}"
    unless recent_events.any? { |event| event["message"] == msg }
      stashboard.create_event(service, "down", msg)
    end
  end
  
  # if service has recent outages, display warning
  unless recent_outages.empty?
    up_services.delete(service)
    warning_services[service] = true
  end

  # if any pingdom check fails for a given service, consider the service down.
  up_services.delete(service) if check.status == "down"
end

Lastly, if any services are up or should indicate a warning then we update their status accordingly,

up_services.each_key do |service|
  current = stashboard.current_event(service)
  if current["message"] =~ /(Service .* unavailable)|(Service operational but has experienced outage)/i
    stashboard.create_event(service, "up", "Service operating normally.")
  end
end

warning_services.each_key do |service|
  current = stashboard.current_event(service)
  if current["message"] =~ /Service .* unavailable/i
    stashboard.create_event(service, "warning", "Service operational but has experienced outage(s) in past 24 hours.")
  end
end

Note that any manually-entered Stashboard status messages will not be changed unless they match any of the automated messages or if there is a new outage reported by Pingdom. This is intentional to allow overriding automated updates if for any reason, some kind of failure isn't accurately reported.

Curious about what the end result looks like? Take a look at Bizo's status dashboard.

When you click on a specific service, you can see individual outages,

We hope this is useful to somebody out there... and big thanks to the Stashboard authors at Twilio, Matt Todd for creating the pingdom-client gem and Sam Mulube for the stashboard gem. You guys rule!

PS: You can download the full Ruby script from https://gist.github.com/975141.

Thursday, April 21, 2011

How Bizo survived the Great AWS Outage of 2011 relatively unscathed...

The twittersphere, techblogs and even some business sites are a buzz with the news that the US East Region of AWS has been experiencing a major outage. This outage has taken down some of the most well known names on the web. Bizo's infrastructure is 100% AWS and we support 1000s of publisher sites (including some very well know business sites) doing billions of impressions a month. Sure, we had a few bruises early yesterday morning when the outage first began, but soon after then we've been operating our core, high volume services on top of AWS but without the East region.


Here is how we have remained up despite not having a single ops person on our engineering team:


1) Our services are well monitored
We rely on pingdom for external verifcation of site availability on a world wide basis. Additionally, we have our own internal alarms and dashboards that give us up to the minute metrics such as request rate, cpu utilization etc. Most of this data comes from AWS Cloudwatch monitoring but we also track error ratesand have alarms setup to alert us when these rates change or go over a certain threshold.


2) Our services have circuit breakers between remote services that trip when other services become unavailable and we heavily cache data
When building our services, we always assume that remote services will fail at some point. We've spend a good deal of time investing in minimizing the domino effect of a failing remote service. When a remote service becomes unavailable the caller detects this and will go into tripped mode occasionally retrying with backoffs. Of course we also rely on caching read-only data heavily and are able to take advantage of the fact that the data needed for most of our services does not change very often.


3) We utilize autoscaling
One of the promises of AWS is the ability to start and stop more servers based on traffic and load. We've been using autoscaling since it was launched and it worked like a charm. You can see the instances starting up based on the new load in the US West region as traffic was diverted over from US East.


(all times UTC)


4) Our architecture is designed to let us funnel traffic around an entire region if necessary
We utilize Global Load Balancing to direct traffic to the closest region based on the end-user's location. For instance, if a user is in California, wedirect their traffic to the US West region. This was extremely valuable in keeping us fully functioning in the face of a regional outage. When we finally decided that the US East region was going to cause major issues, switching all traffic to US West was as easy as clicking a few buttons. You can see how the requests transitioned over quickly after we made the decision. (By the way, quick shout-out to Dynect who is our GSLB service provider. Thanks!)


(all times UTC)


Bumps and Bruises
Of course we didn't escape without sustaining some issues. We'll do another blog post on some of the issues we did run into but they were relatively minor.


Conclusion
After 3 years running full time on AWS across 4 regions and 8 availability zones we design our systems with the assumption that failure will happen and it helped us come through this outage relatively unscathed.

Monday, April 18, 2011

Command Query Responsibility Segregation with S3 and JSON

We recently tackled a problem at Bizo where we wanted to decouple our high-volume servers from our MySQL database.

While considering different options (NoSQL vs. MySQL, etc.), in retrospect we ended up implementing a SOA-version of the Command Query Separation pattern (or Command Query Responsibility Segregation, which is services/messaging-specific).

Briefly, in our new approach, queries (reads) use an in-memory cache that is bulk loaded and periodically reloaded from a snapshot of the data stored as JSON in S3. Commands (writes) are HTTP calls to a remote JSON API service. MySQL is still the authoritative database, we just added a layer of decoupling for both reads and writes.

This meant our high-volume servers now have:

  • No reliance on MySQL availability or schema
  • No wire calls blocking the request thread (except a few special requests)

The rest of this post explains our context and elaborates on the approach.

Prior Approach: Cached JPA Calls

For context, our high-volume servers rely on configuration data that is stored in a MySQL database. Of course, the configuration data that doesn’t have to be absolutely fresh, so we’d already been using caching to avoid constantly pounding the database for data that rarely changes.

There were several things we liked about this approach:

  • We use Amazon RDS for the MySQL instance, which provides out-of-the-box backups, master/slave configuration, etc., and is generally a pleasure to use. We enjoy not running our own database servers.

  • We also have several low-volume internal and customer-facing web applications that maintain the same data and are perfectly happy talking to a SQL database. They are normal, chatty CRUD applications for which the tool support and ACID-sanity of a SQL database make life a lot easier.

That being said, we wanted to tweak a few things:

  • Reduce the high-volume servers’ reliance on MySQL for seeding their cache.

    Although RDS is great, and definitely more stable than our own self-maintained instances would be, there are nonetheless limits on its capacity. Especially if one of our other application misbehaves (which has never happened…cough), it can degrade the MySQL instance to the point of negatively affecting the high-volume servers.

  • Reduce cache misses that block the request thread.

    Previously, configuration data (keyed by a pre-request configuration id) was not pulled into cache until it was needed. The first request (after every cache flush) would reload the data for it’s configuration id from MySQL and repopulate the cache.

    While not initially a big deal, as Bizo has grown, we’re now running in multiple AWS regions, and cache misses require a cross-region JDBC call to fetch their data from the MySQL server running in us-east.

Illustrated in code, our approach had, very simplified, been:

class TheServlet {
  public void doGet() {
    int configId = request.getParameter("configId");
    Config config = configService.getConfig(configId);
    // continue processing with config settings
  }
}

class ConfigService {
  // actually thread-safe/ehcache-managed, flushed every 30m
  Map<Integer, Config> cached = new HashMap<Integer, Config>();

  public Config getConfig(int configId) {
    Config config = cached.get(configId);
    if (config == null) {
      // hit mysql for the data, blocks the request thread
      config = configJpaRepository.find(configId);
      // cache it
      cached.put(configId, config);
    }
    return config;
  }
}

Potential “Big Data” Approaches

Given our primary concern was MySQL being a single point of failure, we considered moving to a new database platform, e.g. SimpleDB, Cassandra, or the like, all of which can scale out across machines.

Of course, RDS’s master/slave MySQL setup already reduces its risk of single machine point of failure, but the RDS master/slave cluster as a whole is still, using the term loosely, a “single point”. Granted, with this very loose definition, there will always be some “point” you rely on–we just wanted one that we felt more comfortable with than MySQL.

Anyway, for NoSQL options, we couldn’t get over the cons of:

  • Having to run our own clusters (except for SimpleDB).

  • Having to migrate our low-volume CRUD webapps over to the new, potentially slow (SimpleDB), potentially eventually-consistent (Cassandra) NoSQL back-end.

  • Still having cache misses result in request threads blocking on wire calls.

Because of these cons, we did not put a lot of effort into researching NoSQL approaches for this problem–we felt it was fairly apparent they weren’t necessary.

Realization: MySQL is Fine, Fix the Cache

Of course, we really didn’t have a Big Data problem (well, we do have a lot of those, but not for this problem).

We just had a cache seeding problem. Specifically:

  • All of our configuration data can fit in RAM, so we should be able to bulk-load all of it at once–no more expensive, blocking wire calls on cache misses (basically there are no cache misses anymore).

  • We can load the data from a more reliable, non-authoritative, non-MySQL data store–e.g. an S3 snapshot (config.json.gz) of the configuration data.

    The S3 file then basically becomes our alternative “query” database in the CQRS pattern.

When these are put together, a solution emerges where we can have a in-memory, always-populated cache of the configuration data that is refreshed by a background thread and results in request threads never blocking.

In code, this looks like:

class TheServlet {
  public void doGet() {
    // note: no changes from before, which made migrating easy
    int configId = request.getParameter("configId");
    Config config = configService.getConfig(configId);
    // continue processing with config settings
  }
}

class ConfigService {
  // the current cache of all of the config data
  AtomicReference<Map> cached = new AtomicReference();

  public void init() {
    // use java.util.Timer to refresh the cache
    // on a background thread
    new Timer(true).schedule(new TimerTask() {
      public void run() {
        Map newCache = reloadFromS3("bucket/config.json.gz");
        cached.set(newCache);
      }
    }, 0, TimeUnit.MINUTES.toMillis(30));
  }

  public Config getConfig(int configId) {
    // now always return whatever is in the cache--if a
    // configId isn't present, that means it was not in
    // the last S3 file and is treated the same as it
    // not being in the MySQL database previously
    Map currentCache = cached.get();
    if (currentCache == null) {
      return null; // data hasn't been loaded yet
    } else {
      return currentCache.get(configId);
    }
  }

  private Map reloadFromS3(String path) {
    // uses AWS SDK to load the data from S3
    // and Jackson to deserialize it to a map
  }
}

A Few Wrinkles: Real-Time Reads and Writes

So far I’ve only talked about the cached query/reads side of the new approach. We also had two more requirements:

  • Very (very) infrequently, a high-volume server will need real-time configuration data to handle a special request.

  • The high-volume servers occasionally write configuration/usage stats back to the MySQL database.

While we could have continued using a MySQL/JDBC connection for these few requests, this also provided the opportunity to build a JSON API in front of the MySQL database. This was desirable for two main reasons:

  • It decoupled our high-volume services from our MySQL schema. By still honoring the JSON API, we could upgrade the MySQL schema and the JSON API server at the same time with a much smaller, much less complicated downtime window than with the high-volume services talking directly to the MySQL schema.

  • The MySQL instance is no longer being accessed across AWS regions, so can have much tighter firewall rules, which only allow the JSON API server (that is within its same us-east region) access it.

The new setup looks basically like:

Scalatra Servlet Example

With Jackson and Scalatra, the JSON API server was trivial to build, especially since it could reuse the same JSON DTO objects that are also serialized in the config.json.gz file in S3.

As an example for how simple Jackson and Scalatra made writing the JSON API, here is the code for serving real-time request requests:

class JsonApiService extends ScalatraServlet {
  get("/getConfig") {
    // config is the domain object fresh from MySQL
    val config = configRepo.find(params("configId").toLong)
    // configDto is just the data we want to serialize
    val configDto = ConfigMapper.toDto(configDto)
    // jackson magic to make json
    val json = jackson.writeValueAsString(configDto)
    json
  }
}

Background Writes

The final optimization was realizing that, when the high-volume servers have requests that trigger stats to be written to MySQL, for our requirements, these writes aren’t critical.

This means there is no need to perform them on the request-serving thread. Instead, we can push the writes onto a queue and have it fulfilled by a background thread.

This generally looks like:

class ConfigWriteService {
  // create a background thread pool of (for now) size 1
  private ExecutorService executor = new ThreadPoolExector(...);

  // called by the request thread, won't block
  public void writeUsage(int configId, int usage) {
    offer("https://json-api-service/writeUsage?configId=" +
      configId +
      "&usage=" +
      usage);
    }
  }

  private void offer(String url) {
    try {
      executor.submit(new BackgroundWrite(url));
    } catch (RejectedExecutionException ree) {
      // queue full, writes aren't critical, so ignore
    }
  }

  private static class BackgroundWrite implements Runnable {
    private String url;

    private BackgroundWrite(String url) {
      this.url = url;
    }

    public void run() {
      // make call using commons-http to url
    }
  }
}

tl;dr We Implemented Command Query Responsibility Segregation

With changing only a minimal amount of code in our high-volume servers, we were able to:

  • Have queries (most reads) use cached, always-loaded data is that periodically reloaded from data snapshots in S3 (a more reliable source than MySQL)

  • Have commands (writes) sent from a background-thread to a JSON API that saves the data to MySQL and hides JDBC schema changes.

For this configuration data, and our current requirements, MySQL, augmented with a more aggressive, Command Query Separation-style caching schema, has and continues to work well.

For more reading on CQS/CQRS, I suggest:

  • Both the Wikipedia article and Martin Fowler’s CommandQuerySeparation, however they focus on CQS as applied to OO, e.g. side-effect free vs. mutating method calls.

  • For CQS applied to services, e.g. CQRS, Udi Dahan seems to be one of the first advocates of the term. Since then, CQRS even seems to have it’s own site and google group.

Friday, April 15, 2011

Crowdflower Trickery: dynamic tasks

Here at Bizo, we often use crowdflower to improve the quality of our data. In doing so, we’ve come across some cool, but under-documented, tricks. One trick that we’ve particularly found useful is using liquid for designers to dynamically generate crowdflower tasks. Let us take a look at how to do this with a toy example.

Problem:
We are given a list of deserts from a bakery as shown in data.csv bellow . Our task is to determine the following:

1. If the desert is a cake, is it appropriate for:
  • Wedding events
  • Birthday events
  • Casual eating
2. If the desert is NOT a cake, is it appropriate for:
  • eating using hands
  • eating using forks
  • eating using spoons
file: data.csv
"id","name","desert_type"
0,"Peanut Butter Cake","cake"
1,"Strawberry Donut","donut"
2,"Cookies and crème ice cream cake","cake"
3,"Apple Strudle","strudle"
4,"Chocolate Pie","pie"
5,"Red Velvet Cake","cake"


Initial Approach:
One approach is to create two separate jobs: one which will ask workers questions relevant to cakes and one which will ask the workers questions relevant to non-cake deserts. To create these jobs we would first have to break up our data into two data files: one containing data only for cakes (see cakes.csv) and one for everything else (see non-cakes.csv). Then, we would have to specify the appropriate cml code for each job. For our example, the data and cml code will look like:

Job 1: Cake deserts
file: cake.csv
"id","name","desert_type"
0,"Peanut Butter Cake","cake"
2,"Cookies and crème ice cream cake","cake"
5,"Red Velvet Cake","cake"

file: cake.cml
Desert: {{name}}
<cml:checkboxes label="This desert appropriate for">
<cml:checkbox label="wedding events"/>
<cml:checkbox label="birthday events"/>
<cml:checkbox label="casual eating"/>
</cml:checkboxes>

Job 2: Non-cake deserts
file: non-cake.csv
"id","name","desert_type"
1,"Strawberry Donut","donut"
3,"Apple Strudle","strudle"
4,"Chocolate Pie","pie"

file: non-cake.cml
Desert: {{name}}
<cml:checkboxes label="This desert appropriate for">
<cml:checkbox label="eating using hands"/>
<cml:checkbox label="eating using forks"/>
<cml:checkbox label="eating using spoons"/>
</cml:checkboxes>


Approach using Liquid:
Using liquid, we can solve the same problem with just one job rather than two. To do so, we simply embed liquid logic tags into our cml code to dynamically display tasks to users -- the appropriate checkboxes will appear based on the "desert_type" field. Furthermore, we do not need to break up the data.csv file.

cml code
Desert: {{name}}
<cml:checkboxes label="This desert is appropriate for">
{% if desert_type=='cake' %}
<cml:checkbox label="wedding events"/>
<cml:checkbox label="birthday events"/>
<cml:checkbox label="casual eating"/>
{% else %}
<cml:checkbox label="eating using hands"/>
<cml:checkbox label="eating using forks"/>
<cml:checkbox label="casual using spoons"/>
{% endif %}
</cml:checkboxes>